
Share
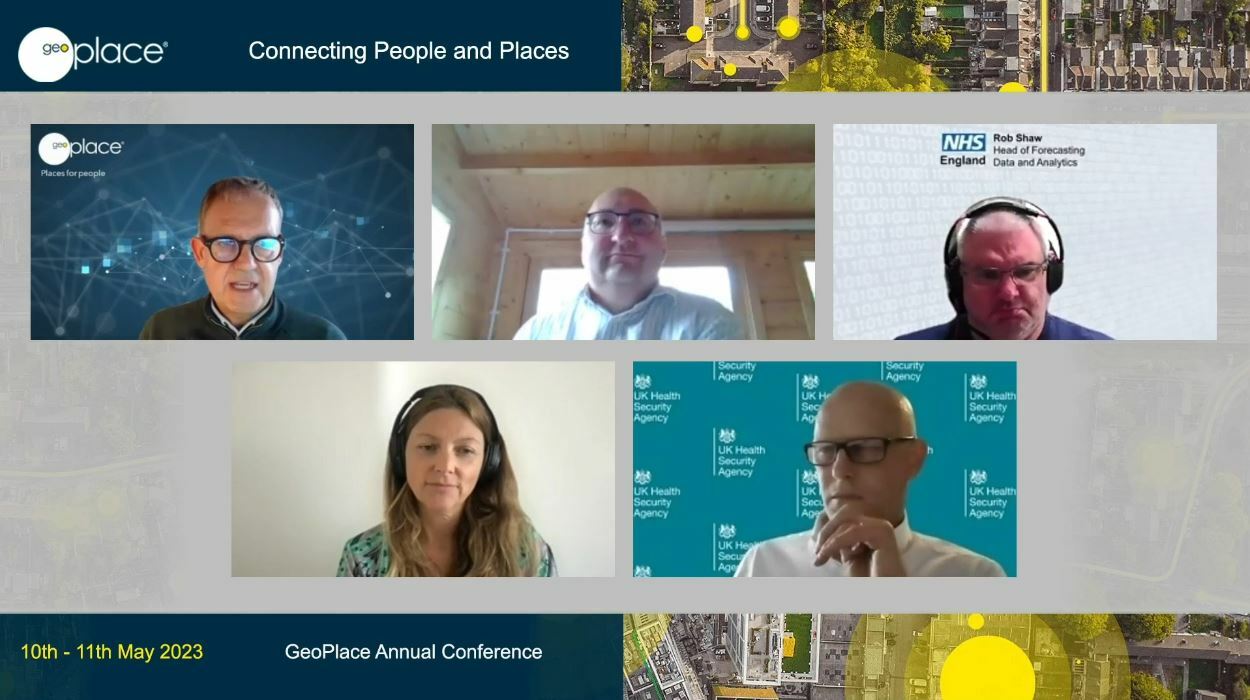
Day 1, session 4 of the 2023 GeoPlace conference focussed on using UPRNs to transform health and save lives.
SPEAKERS:
- James Lockyer, Senior Data Developer, NHS England
- Rob Shaw, Head of Forecasting, Analytical Services, Data, Analysis & Intelligence Service, NHS England
- Dr Gill Harper, Honorary post-doctoral Research Fellow in Health data Science, Clinical Effectiveness Group, Wolfson Institute of Population Health, Barts and The London School of Medicine and Dentistry, Queen Mary University of London
- Dr Nick Watkins, Deputy Director – Data Science & Geospatial and Chief Data Scientist, UK Health Security Agency
Watch the recordings of this session's talks on the 10th May tab on the conference agenda
Using UPRNs to transform health
James Lockyer opened the session on health improvement with standout insights about the most recent integration of Unique Property Reference Numbers (UPRNs), into NHS England (NHSE). The NHS is under massive operational pressure and each part of the ecosystem operates with different systems that often can't talk to each other. This means there are many operational hand-offs within and between organisations, and it’s hard to provide high quality information that can streamline workflow and enable data driven timely decision making. This makes it hard for health and care organisations to collaborate to solve problems, plan services for local populations and ultimately to deliver better care for the people they serve. However, the organisation has been using UPRNs to provide insights on population health management and health inequalities for several years, scaling up more recently. One of the key drivers for UPRN use, is data quality. Within the NHS, addressing is a direct flow of information from the consumer (patient) through to the ‘spine’ of the local facility, and then on into the NHSE ‘data lake’.
Within the ‘spine’, information may be entered or altered from practices, hospitals and other providers. Live updates contribute to a dataset holding 95 million discreet addresses, and information about more than 82 million patients including living, deceased and deducted individuals: multiple instances of addressing have been entered over a period of time, but when addresses are now entered into the system, address matching software and is used to filter out problems. This has included retrospective matching using off the shelf software, but also Address Base Premium and PAF data to determine potential UPRNs for those addresses. However, modernisation and changes to NHS infrastructure mean the need for as much automation as possible is key. To date, 46.1 million addresses have been processed to improve their accuracy – the most recent addresses captured – but this means there are another 50 million records to assess, all relating to patient address histories.
Within this activity, each address is given a match score and an indication of what, if anything, was wrong with the address when it was first entered into the ‘spine’. UPRN coverage is around 93.73%, with a false positive match of around +1% (and around 300,000 addresses are unusable and need further intervention), but in short, 93.5 % of NHS numbers can be linked to a UPRN.
NHSE uses the UPRN in its analysis to relate people to the environment, to understand relationships, to better inform decision-making, and to create a landscape of information that influences health and outcomes. Crucially, this links into the wider picture for care outside medical facilities: a good example is the use of UPRNs in care homes. This delivers more than a flag for the number of people living in a care home: it provides insights on how long people have lived there, when they’ve moved in or out of care, and also the patients’ full care home address history. At the moment, there is no timely or frequent collection of information about persons receiving care at the national level. But this data is essential – the population is ageing, expanding, and becoming more complex. The ability to identify the care home population is essential for monitoring activity and targeting healthcare services appropriately. Pseudonymised patient-level datasets – enriched with the UPRN – help the NHS to develop a comprehensive picture of patient pathways and how the care home population navigates through the healthcare system.
Covid-19 was a catalyst for change within the NHS – new ways of thinking were needed, and this is an ambitious period of change. Now though, with the UPRN embedded at the heart of core systems, pseudonymised analysis is possible for all kinds of service. Accurate, verified, federated data enables costs to be reduced with confidence. It also enables disparate teams or departments to create and access patient-data platforms for a 360-degree patient and citizen view, and to deliver higher quality health and care experiences across multiple channels. Underpinned by ‘a single version of the truth’, the UPRN correlates information that is otherwise inconsistent, and health insights are possible that may improve health systems and drive behavioural change.
Going forwards, Jim explained that that the opportunity is to utilise AddressBase and OS Places API to enable UPRN capture and flow, from NHS registration to Personal Demographics Service (PDS) in the NHS Spine, to unlock the power of UPRN analytics downstream.
How the UPRN saved lives: a story of vaccinating for COVID
Rob Shaw continued with a presentation from his perspective as the Head of Forecasting, Analytical Services, Data, Analysis & Intelligence Service, for NHS England – focusing on the use of the UPRN during the recent Covid-19 pandemic. NHS hospitals were under huge pressure from COVID – over 30% of all beds occupied with COVID patients at the peaks. But by using the UPRN, the organisation was able to create a pseudonymised individual-level regression model that could identify key drivers of COVD admission risk.
Location data can be critical to supporting analysis and government response in times of crisis, such as the Covid-19 pandemic. For the NHS, data around the characteristics, location and movement of the population was all important in shaping a response. NHS England (NHSE) needed to understand who was at greatest risks of infection and illness – and then as vaccines became available, the uptake rate of vaccinations, and how it varied.
NHSE had experience with pseudonymised person-level models, as it this approach came into use with formulas for distributing money. That was at a national level, whereas many of the key services for pandemic-response demanded more localised insights. However, just before the pandemic, UPRN linkage of NHS registered patient became available. This enabled linkage to new datasets that might be relevant for Covid-19 analysis - things like information about private outdoor spaces and their size, as well as characteristics of each property. Analysis of citizen grouping within pseudo-UPRNs meant that teams could infer different household type (living alone, two adults with or without children, or multigenerational households), and plan accordingly.
After the Covid-19 vaccination programme began, it was clear some groups in the population were much less likely to come forward. NHSE adapted its model to identify factors associated with low vaccine uptake – made visible more easily using UPRNs. The findings were crucial for ongoing modification of efficient and effective vaccine rollouts. For example, there was huge variation by ethnicity; household type was significant (the uptake was >10% lower in multi-adult and multi-generational households), and property type had an influence too – generally showing higher uptakes for those people associated with more affluent properties, such as a detached home rather than a flat.
Conversely, analysis showed that hotels, hostels, HMOs and other ‘irregular’ properties were linked with significant lower uptake (5-10%). But the datasets also revealed that some disabilities and lifestyle conditions could be authoritatively associated to lower uptake: serious mental illness (-4.9%) and learning disabilities (-0.7%), for example, as well as alcohol dependence (4.7%) and Level 3 Frailty (1.5%). In short. linkage to data on Covid-19 vaccination enabled NHSE to identify individual and neighbourhood characteristics that were associated with vaccine uptake but without risk of data disclosure. Coding data with UPRNs opens up significant opportunities to correlate other datasets with confidence. In the last few months this has included council tax bands, Energy Performance Certificate data, and tenure. These data can lead to the significant improvement in models and better decisions, patient outcomes and/or value for money – although Rob finished with a reminder that, even with pseudonymisation, the theoretical risk of accidental or malicious disclosure is still prevalent. Secure access, training and monitoring are important.
Dr Gill Harper gave a presentation on ‘ASSIGN’ – the algorithm that links UPRNs with primary care health records, enabling the accurate analysis of large health datasets at household level. This is a joint initiative between the Clinical Effectiveness Group (CEG), Queen Mary University of London and Endeavour Health Charity – it uses human pattern recognition to match data in patient health records with UPRNs in AddressBase Premium.
Gill iterated the importance of using accurate addressing in electronic health records. GP patient health records contain data about a local population’s health; de-identified patient addresses can inform innovative insights into wider determinants of health problems. As an example, the North East London Integrated Care Board (NEL ICB) services 277 general practices in 8 London boroughs, caring for more than 2 million people. This is a diverse and urban population, with many citizens living in flats and student accommodation. Patient records and addresses are published daily to the NEL Discovery Data Service and associated subscriber databases. That information can then be used to analyse and calculate the health impacts for many situations. Over-crowding, for example; household clustering of multi-morbidity, household vulnerability to childhood obesity and non-uptake of childhood vaccinations. But while the Clinical Effectiveness Group (CEG) at Queen Mary UoL and Endeavour Health Charitable Trust could see that analysis at household level would be beneficial, no working models existed to quickly and accurately address-match disparate data with UPRNs.
The ASSIGN algorithm was created: an address matching algorithm that uses human pattern recognition to match the addresses in patient health records with UPRNs in AddressBase Premium (ABP). ASSIGN allows for character swaps, abbreviations and spelling mistakes, is transparent, free and Open Source. Most importantly perhaps, it is quality assured: ASSIGN delivered a 98.6% match rate on 38,000 records per minute for NEL ICB. By developing a method for assigning UPRNs to patient records in bulk and near real-time, more frequent updates are now possible.
Around 7 million citizens in London now benefit from the use of ASSIGN, and the algorithm’s use is being scaled up across NHS London, Wales, Scotland and local authorities. Dr. Harper concluded by noting that an increase in UPRN-usages requires transparent and standardized matching approaches. Address styles still vary, as does recording, data feed and match rates according to data quality. ASSIGN has been adjusted for this – it now has a match rate of >98.5% versus likelihood of false positives – and continues to evolve with user feedback and address changes.
Dr. Nick Watkins brought this session to a close, with a presentation on the use of location data in improving health security. The UK Health Security Agency (UKHSA) is responsible for protecting every member of every community from the impact of infectious diseases, chemical, biological, radiological and nuclear incidents and other health threats. To do this, it provides intellectual, scientific and operational leadership at national, local and international levels.
This includes responses to infectious diseases such as SARS1, Ebola, influenza, Sars-Cov-2, and MPOX. Location data is critical to this work. The Analytics and Data Science Directorate is responsible for pioneering insight development, analytics and modelling, but UKHSA uses geospatial and UPRNs across many of its functions. The overarching vision for UKHSA is to make the UK’s health secure by putting the full power of health and non-health data in the hands of those who need it. This is a long-standing initiative, having been set up first as the Health Protection Agency in 2004, although many people are more familiar with ‘Public Health England’, which was one of the precursor organisations to UKHSA.
The department’s geospatial strategy sets out how it will unlock the power of location data to achieve its mission. Use cases explain how the team works to find, prevent, and respond to threats. These include radon detection, climate change and vulnerability mapping, Covid-19, and Geoanalytics.
In radon detection, location data is at the heart of the interactive pop-up tool showing indicative highest radon potential in 1km grid square. Its first iteration had 3.1 million views (Dec 2017 -> Dec 2022), while the current version has had 160,000 views since Dec 2022.
The Centre for Climate and Health Security’s vulnerability mapping project has been developed in a partnership between UKHSA, the University of Bristol, and the South Gloucestershire local authority. It uses location data to understand population vulnerability in connection with the impacts of climate change. A proof-of-concept mapping visualisation tool has been created for indicators, sub domains and vulnerability indices for local action.
The Covid-19 dashboard is hugely popular as a public-facing tool. At its peak, it handled upwards of 800 million rows of data. The OS Places API was used to help create the dashboard to support contact tracing. The Covid-19 line-list validation process included iterative full, fuzzy matching 7 days a week – enabling scalable address geography for cluster detection, and visualisation in dashboards.
In the future, consistency in the use of location data is key, together with increased interoperability with ONS and OS data. Research themes within the geospatial strategy include more support for innovation, collaboration and analytics that will look at subjects such as vulnerable populations, health equity and inclusion, population estimation and climate change.