
Share
Spatial data has immense value for revealing insights, planning new policies and decision-making at a strategic level. For the City of London Corporation, it’s been essential to use Unique Property Reference Numbers (UPRNs) from their Local Land and Property Gazetteer (LLPG) data to successfully index the information they needed for development of the authority’s Local Plan.
To support the evidence base for its Local Plan, the City of London Corporation produces a spatial analysis showing Principal Land Use Distribution and an insight that focuses on Tall Buildings and Protected Views in the area. For this work – ultimately, to inform a review of the City’s overall planning policy – the key focus was on four principal land uses: offices, retail, housing and hotels.

Data needed to be derived from the City of London’s Local Land and Property Gazetteer (LLPG), and then blended with other information detailing floorspace and classifications relating to respective use. The history, height, architect and key architectural details of tall buildings in the City were also then indexed to the LLPG and, at the same time, correlated with a photo library of those buildings (the City of London’s photo library provides a historic record of each building, which is useful for illustrating reports and for minimising the need to visit each site).
Here, we’ll look at how officers from different teams at the City of London Corporation, responsible for; the Local Plan; the monitoring of development and the delivery of the LLPG; the provision of tools through the corporate GIS; worked together to enable the delivery of reports including both a statistical and spatial analysis of key land uses.
It’s easier to provide up-to-date insights by using the UPRN
Within the City of London Corporation, several ancillary datasets are linked to the LLPG an updated with the addition of new records, changes in Land Use Classification, and any new occupations.
For example, the monitoring of construction works provides information for updating the LLPG. If a new property is under construction then the record is set up as a provisional record on the LLPG. When it becomes a live record, a range of information can then be added to several ancillary datasets.

Within the City of London, those ancillary datasets focus on four principal land uses: offices, hotels, housing and retail. This makes up most of the existing and new schemes in the City. The starting point is the Basic Land and Property Unit (BLPU) Land Use Classification. Where a Unique Property Reference Number (UPRN) has a relevant land use classification, that information can be linked to data in one of the tables linked to the LLPG.
For office land use, for example: the land use is classified as LLPG BLPU Classification CO01, which identifies it as B1 Use Classes Order Floorspace, as set out in planning application form templates published on the gov.uk pages. As a London Borough, information about the progress of development schemes is monitored by Use Class Order and reported on the London Development Database. At a local level, the City of London provides an online tool on the page Development. For other land uses, a range of other information is also needed (the number of habitable rooms in housing, the number of bedrooms in hotels, for example).
Spatial data provides evidence for use in analysis and reports
In the City of London, these are the four main land uses. We’ve included examples of the reports that can be created from in-depth spatial data:
- Offices – Floorspace sourced from planning applications and pre 1990 Land Use Survey - Offices in the City of London
- Retail – Floorspace, Use Classes Order, sourced from planning applications and pre 1990 Land Use Survey, Disabled Access Assessment, detailed shop code on use, retail frontages in PSCs - Retail Units in the City of London
- Housing - All housing details of number of habitable rooms, type of housing. Most housing in the City of London is in blocks of flats thus for mapping outputs aggregate number of housing units to the parent UPRN - Housing Stock in the City of London
- Hotels - Number of bedrooms, grade, sourced from planning applications - Hotels in the City of London
With that land use information, the City of London Corporation can produce all kinds of insights tailored to specific planning policy issues. For example, a proportional point is used based on floorspace (m2), for hotels a proportional point is used based on number of bedrooms. For housing the approach is slightly different: most housing in the City of London is located in blocks of flats so housing need to be a proportional point based on the number of habitable rooms aggregated to the parent record.
This enables a detailed spatial analysis of the principal land use distribution within the City of London (this snapshot represents the status as at 31st March 2019).
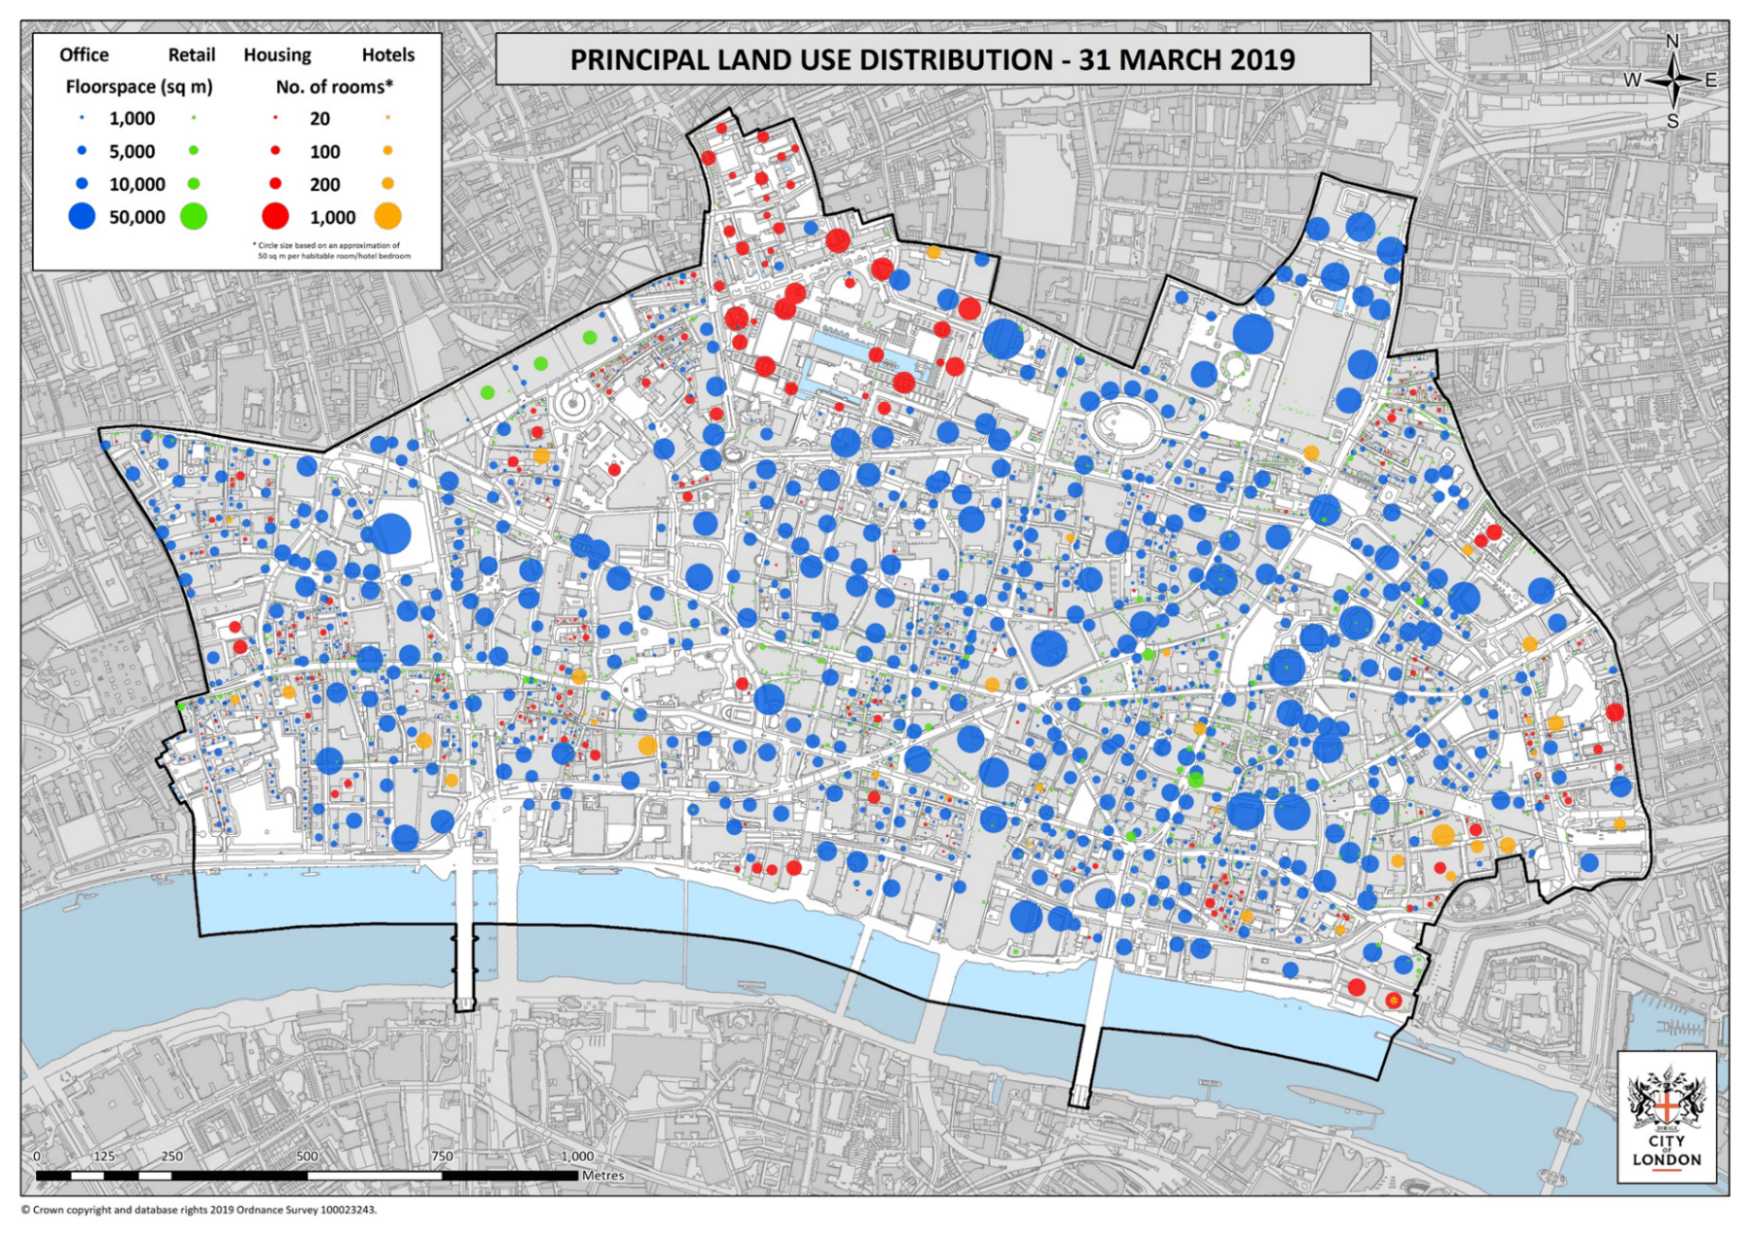
Figure 1: Principal Land Use Distribution Map (as at 31st March 2019)
This particular snapshot shows the dominant land uses on a site-by-site basis, so it’s a very useful tool for highlighting differences in size and spatial distribution of these land uses throughout the City. The information provides evidence that enables officers to work collaboratively on reviews of the City of London Local Plan and other reports. For example, Offices in the City of London is used to analyse office distribution. Other reports access the underlying data in the same way.
The City of London is primarily a business district but does have concentrations of housing. This snapshot shows sets out the distribution of housing analysed by residential area (31st March 2019). It shows concentrations in a number of key estates, plus an evolving level of housing in the outer areas of the City.
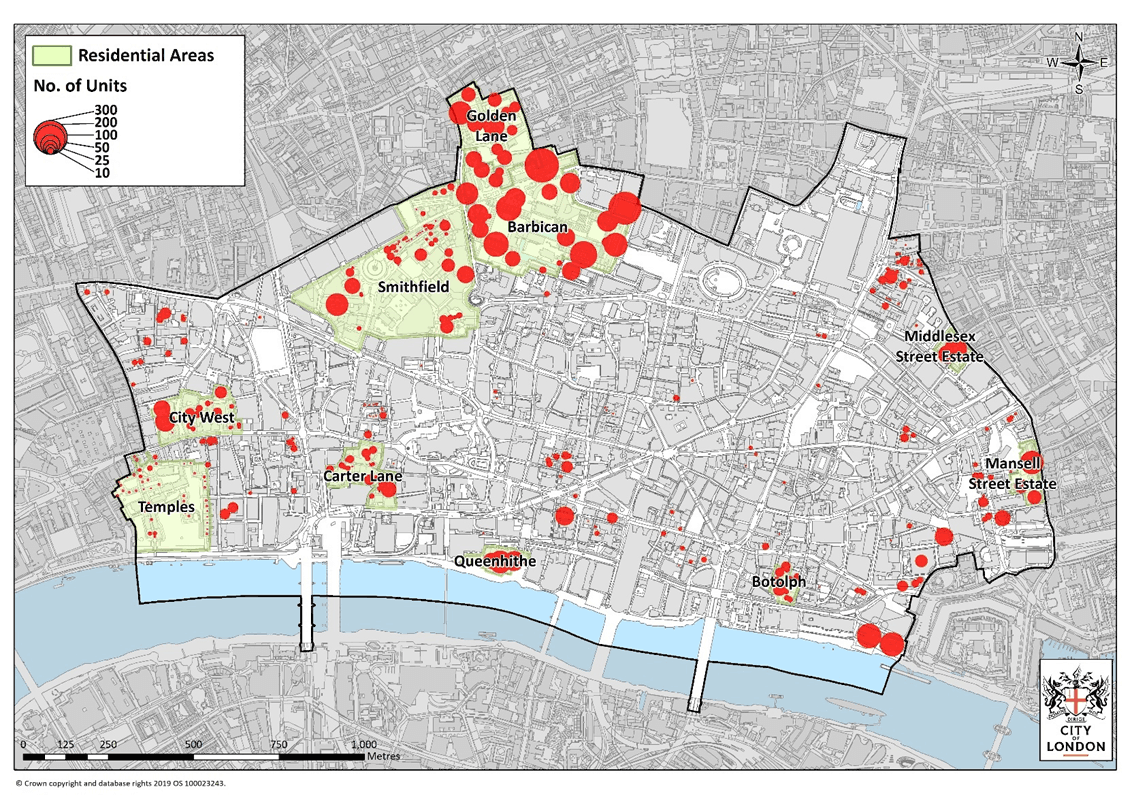
Figure 2: The number of Housing Units in the City of London analysed by Residential Area (as at 31st March 2019)
The City of London has seen a large increase in hotel accommodation in the last ten years. Here, we can see hotels in the City of London with an analysis by the number of bedrooms. For each site, information is provided on the address, number of bedrooms, name of hotel. For example, Site 1 is Doubletree by Hilton Hotel at 7 Pepys Street with 602 rooms of which 30 are accessible rooms, opened 2011.
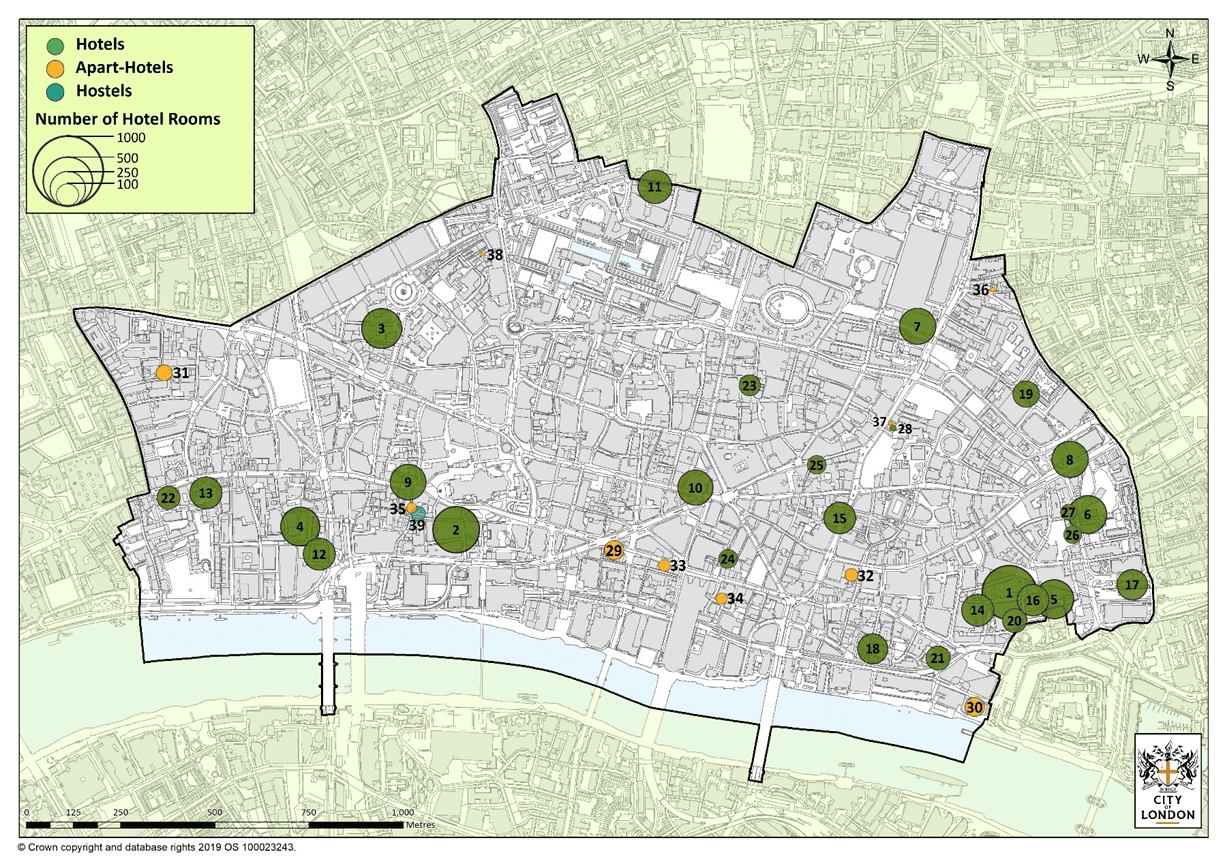
Figure 3: Hotels in the City of London including site numbers analysed by number of bedrooms (as at 31st March 2019)
And this is a review of the Cheapside Principal Shopping Centre (PSC), defined in the City of London Local Plan, analysed by UCO and Floorspace Size. For a PSC, the key policy issue has been to retain the A1 use which is primarily conventional shops.
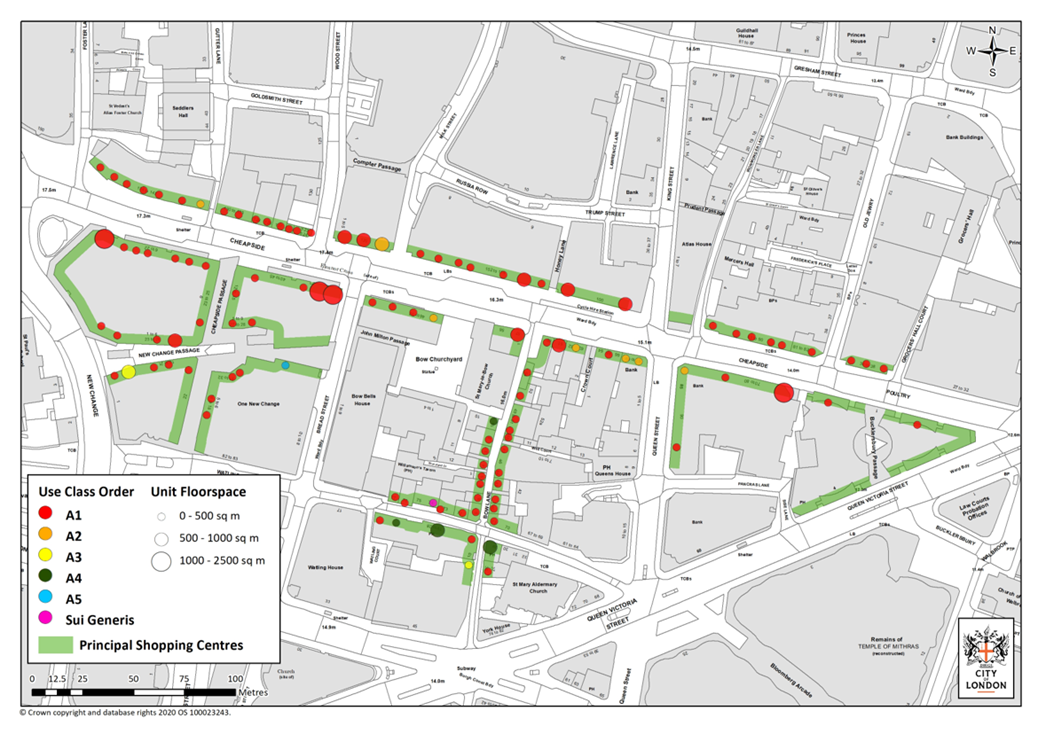
Figure 4: A review of the Cheapside Principal Shopping Centre analysed by Use Classes Order and Floorspace Size (as at 31st March 2019)
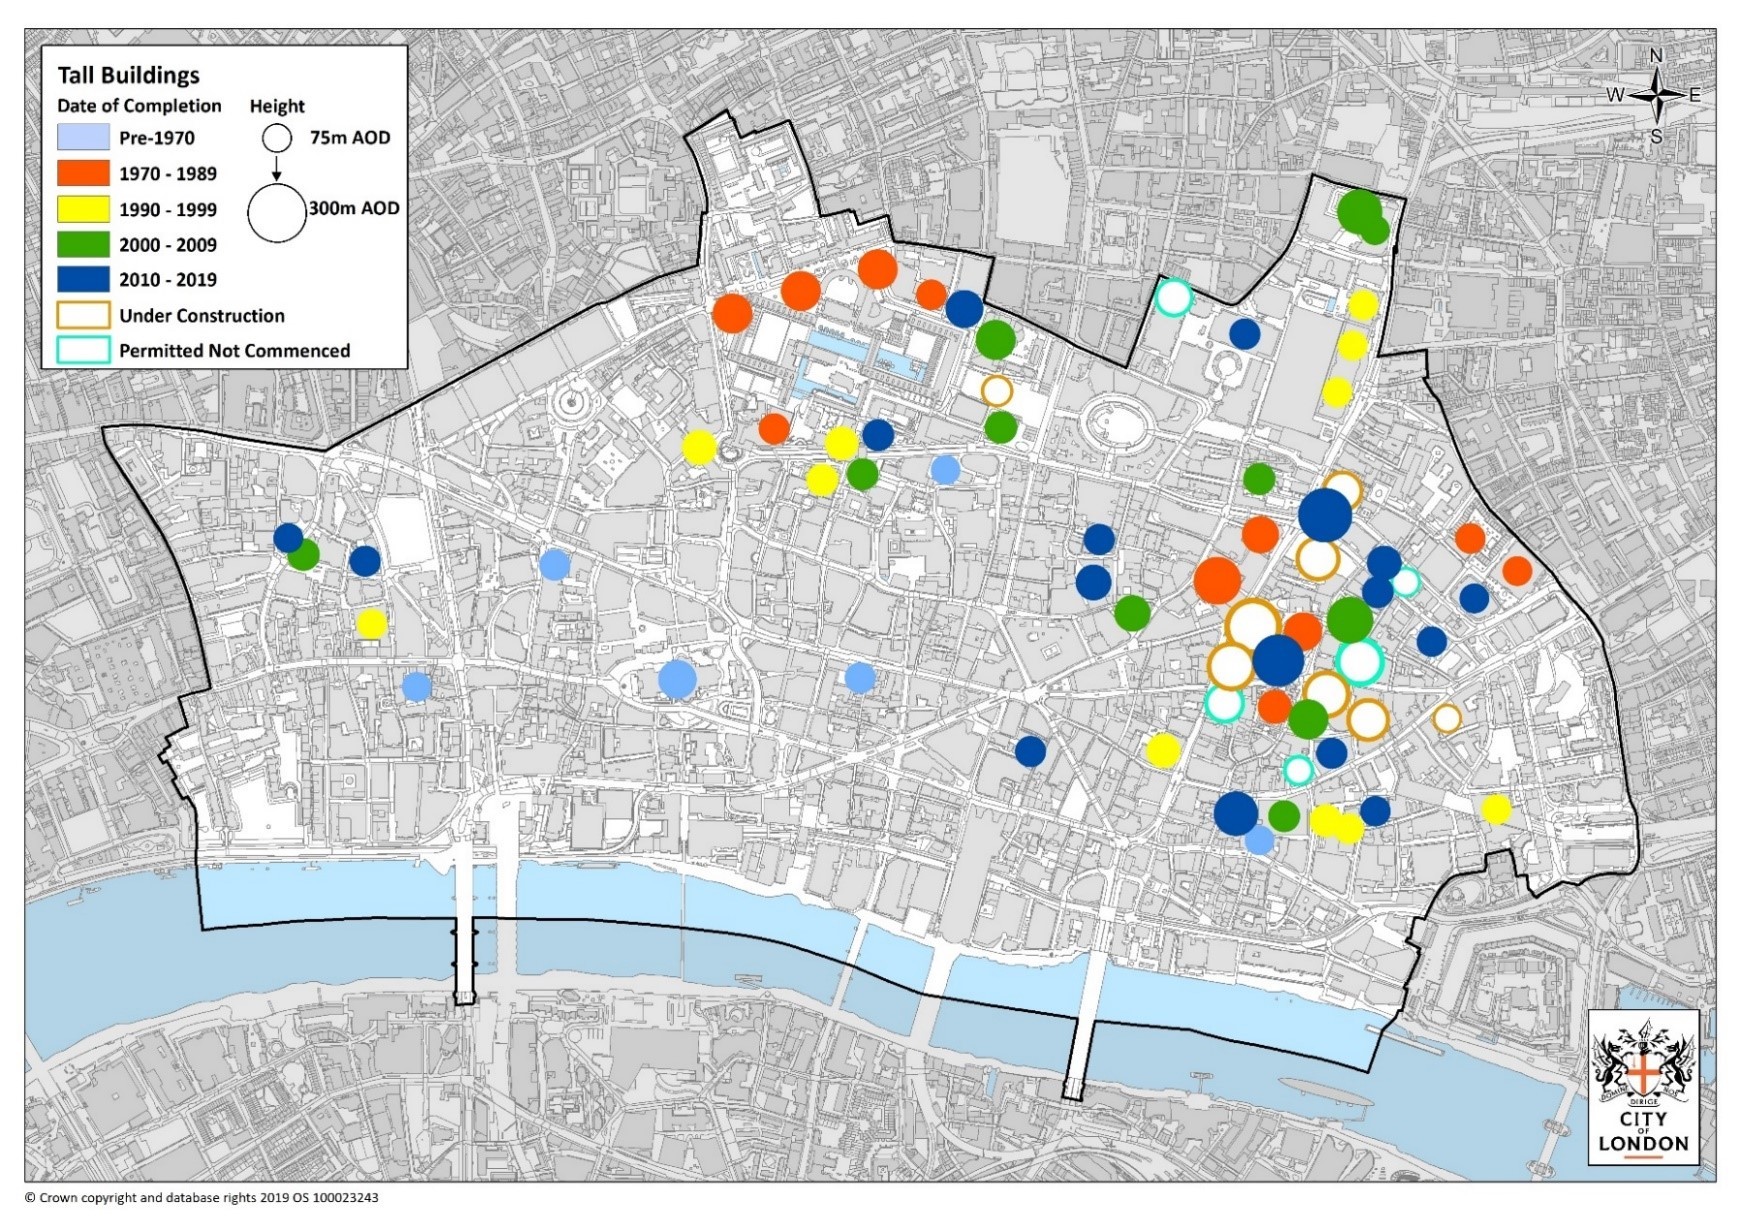
Figure 5: City of London Tall Buildings distribution by height and year of completion (as at 31st March 2019)
Tall buildings’ data – shaping policies and evidencing decisions
In recent years in Central London there’s been a significant delivery of tall buildings. The City of London has policies relating to Tall Buildings (Policy CS14) and Protected Views (policy CS13) set out in the Local Plan, and these planning considerations attract a lot of interest. For each tall building, information is recorded on the planning permission, Height Above Ground Level, Height Above Ordnance Datum, number of floors, year completed, architect. A range of other information is derived from the land use data reports, and photographs from the photographic library. These are datasets indexed to the UPRN.
The Tall Buildings in the City of London report includes this map, showing the spatial distribution of tall buildings in the City of London analysed by year of completion and height of building. It shows a concentration in the eastern area and northern areas of the City, but few tall buildings near the river frontage or in close proximity to St Paul’s Cathedral where there are a range of planning policies to protect the views of the Cathedral.
This work provides essential data connections that underpins key analysis for the City of London. This enables the City of London Corporation to produce spatial evidence-based documents which have the prime purpose of contributing to a sound evidence base for the review of the Local Plan.
June 2020.