
Share
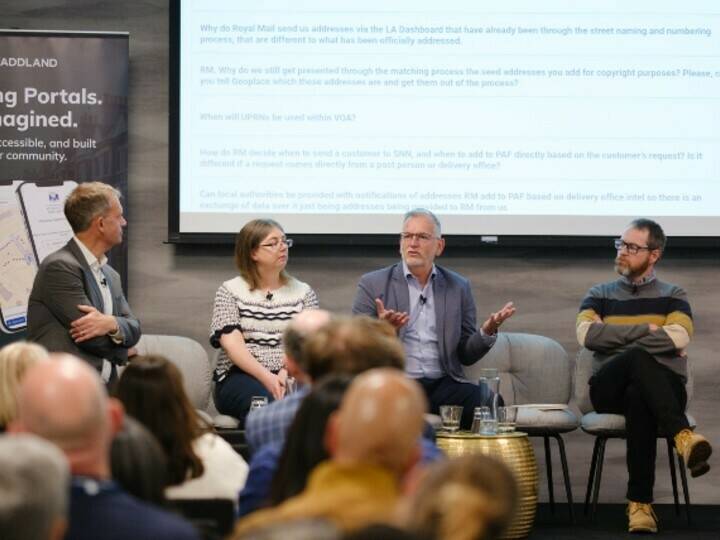
Simon Bailey, Senior Partnerships Lead, GeoPlace introduced the afternoon session, with three different views of the landscape for highways authorities.
Recordings of the 2025 conference talks can be found here
SPEAKERS
- Simon Bailey, Senior Partnerships Lead, GeoPlace
- Jeff Elliott, Highways, Transport and Planning, West Sussex County Council
- Dr Elizabeth Wloch, Road Length Statistics Lead, Road Network Statistics, Department for Transport
- Richard Groombridge, Strategic Product & Data Development Manager, GeoPlace
- Katie Packard, Product Manager, Ordnance Survey
- Nicky Southam, Strategic Product Manager, Ordnance Survey

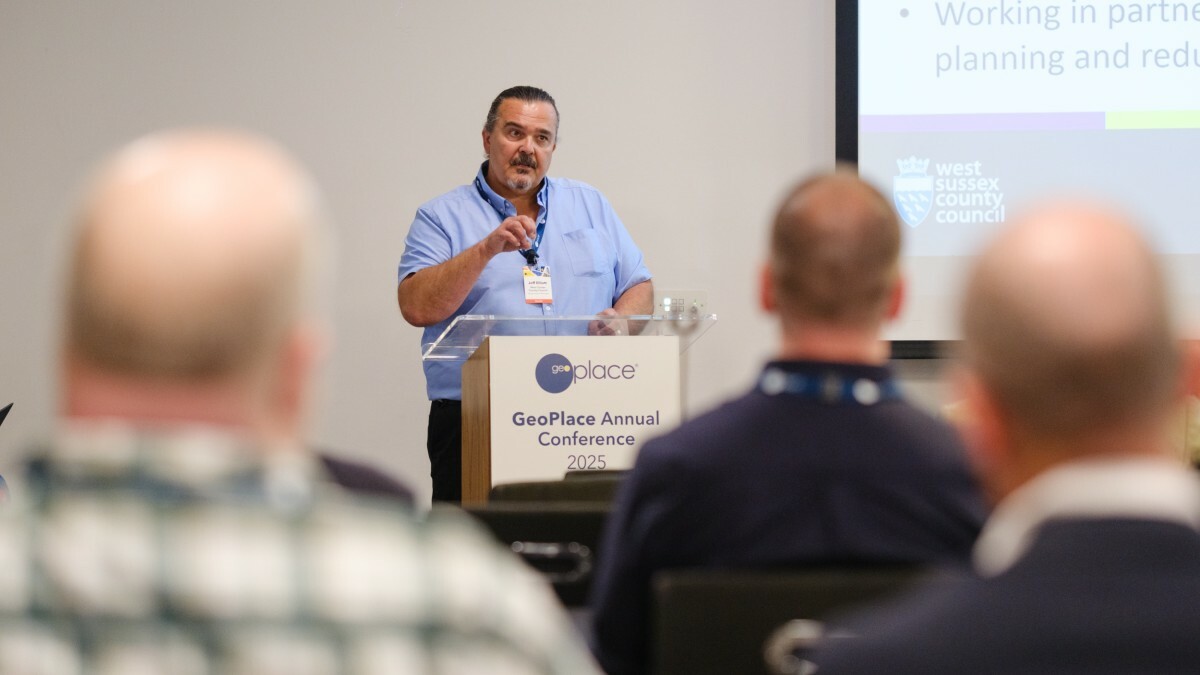
Jeff Elliott, Highways, Transport and Planning, West Sussex County Council
Jeff Elliott took the stage with both conviction and context. A former Gazetteer Custodian himself, he opened by reflecting on how far the field had come—recalling the days when separate teams across a council maintained their own isolated versions of street data. Street lighting had its streets. Traffic signals had theirs. Highways another. “But bringing it all together under one team,” he said, “changed everything.”
For Jeff, the Local Street Gazetteer isn’t just a dataset. It’s infrastructure. “Why is it important? It’s like asking why air is important. It feeds us. It keeps everything moving.” Without it, he said, councils lose control of the network. “You can’t monitor properly. You can’t find your assets. You can’t fix what’s broken.” More than a list of roads, the Gazetteer is a living reference point. A foundation. And it supports far more than just mapping—especially in the age of new regulations like lane rental.
Lane rental charges are a prime example. Without accurate Gazetteer data, works promoters are left guessing: “Which part of the street is chargeable? At what times? When can we work without incurring fines?” These aren’t trivial sums, Jeff noted, and having incomplete data “causes all sorts of issues.” He shifted into sustainability. “If we want to work more sustainably—towards zero carbon—then we need to forward plan with purpose. The Gazetteer can tell us what the road is made of. If it’s due to be dug up again soon, we can use different materials now. Spend a bit more upfront, avoid repeated disruption later.”
This kind of insight, he argued, has to be embedded from the start of the planning process—not bolted on at the end. Too often, he said, “roadworks are booked at the last minute, even though they’ve been planned for years. Nobody thinks about the disruption to the public until they’re asking for road space. By then, it’s too late.”
What he wants is a culture shift: early conversations. A partnership approach. “You need to talk before you even know how much road space you need. Use the Gazetteer to inform your design—whether it’s widening a road, laying a new gas main, or upgrading a junction. That’s how we minimise disruption.” Lane rental has helped West Sussex bring in new resources, he added, and he wants those surplus funds to support this kind of strategic, joined-up planning. “No more computer-says-no. No more last-minute scrambling. The information’s there—we just have to use it properly.”
Jeff also touched on practical challenges. Heat network installations, for instance, often require deep, wide trenches. But too often, contractors only discover late in the process that they needed to coordinate with traffic signal teams months in advance. “It can take six weeks just to get someone to look at the form, let alone switch the lights off.” This is avoidable. “The information was there. If they’d used the Gazetteer early, they’d have known.”
He showed a complex map as an example. High Street, Worthing, appeared twice—once correctly, once misleadingly. “GeoPlace are doing important work to help us identify part-streets, and attach more granular data to the USRN. Not every street is uniform. You might have different reinstatement needs, traffic sensitivity, or regulatory designations across the same road.”
This level of precision is crucial for sustainability too. “If you're moving through sections of highway where the surface changes, you need to know that. The reinstatement requirements may be totally different.”
And then there’s communication. “If we had this level of forward planning, we could get the bus companies involved early. Let them adjust routes, notify passengers, avoid fines. But if you tell them two weeks before, it’s catastrophic. Six months? They can plan, mitigate, even help with publicity.”
He called this the shock and awe problem—the public outrage when they feel blindsided. “Councils, utilities, contractors—we’re always the villain. But that’s because people say: ‘I didn’t know this was happening.’ That’s what we have to fix.” The Gazetteer, Jeff concluded, can empower works promoters. It can reduce disruption. But only if it’s accurate, well-maintained, and used early. “Tell people early. Use the information. Avoid the noise.”
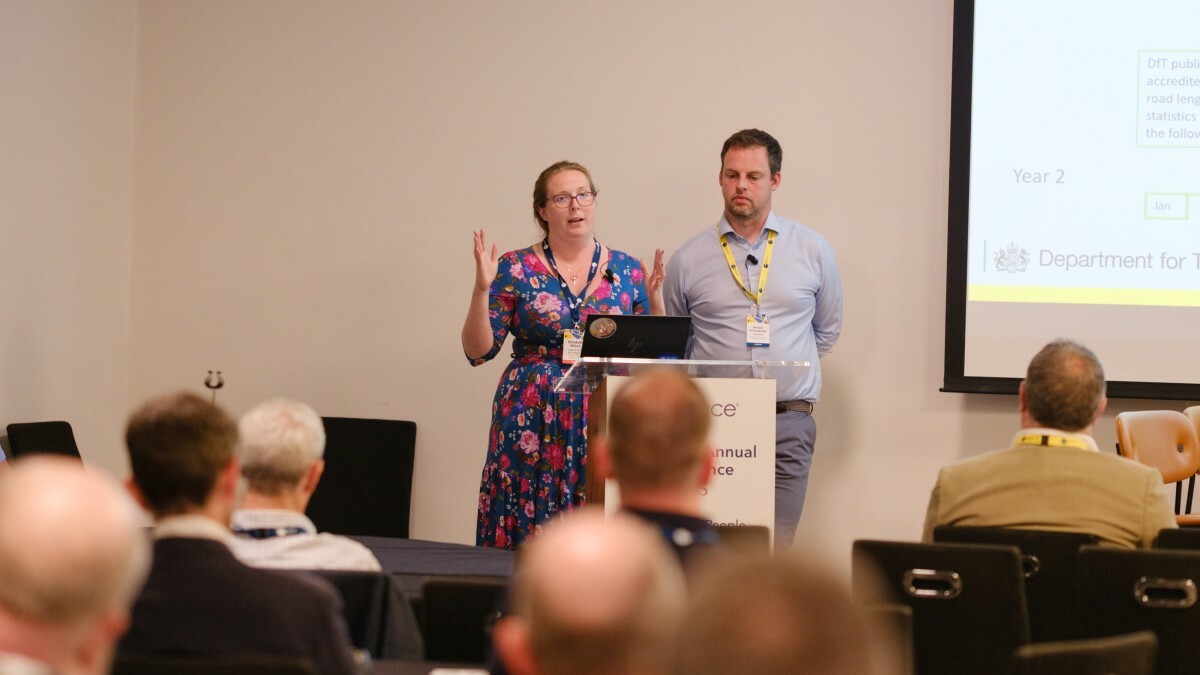
Richard Groombridge, Strategic Product & Data Development Manager at GeoPlace, and Dr Elizabeth Wloch, Road Length Statistics Lead, Road Network Statistics, Department for Transport
Richard Groombridge and Dr Elizabeth Wloch delivered a comprehensive update on the transformation of road length reporting in England. Their goal is to move beyond the R199B data collection process and towards a smarter, joined-up system based on data already held in the National Street Gazetteer (NSG) and OS Highways.
Richard opened the session with context. “Those of you who’ve been around a while know we brought Highways and the NSG back together to get to this point,” he said. “The end goal is simple: eliminate the R199B process and streamline road length reporting.” Dr Wloch then stepped through the current system.
Every year, the Department for Transport (DfT) publishes official statistics on road lengths across Great Britain, using a snapshot of the network from April 1st. The R199b process is run every four years to collect data from local authorities, and is the primary data source—but the process is cumbersome, outdated, and unpopular. In non-R199B years, DfT needs to estimate road length growth using interim data. Historically, this meant applying generic growth factors from OS Highways—but that too has limitations. “It’s not just about funding,” Elizabeth stressed. “Road length data feeds into road safety, congestion, and traffic statistics. It matters to a lot of teams.”
So why the delay between the April snapshot and final publication the following spring? Elizabeth broke it down: once local authorities submit Local Street Gazetteer (LSG) data, it goes from GeoPlace to OS in May. DfT receives it after publication and begins validating it—especially for the Major Roads Database, which underpins critical processes like assigning traffic count sites. “There’s a huge safety element here. You’re putting equipment in live roads. That requires multiple approvals and time.”
From December, the dataset is finally processed for official statistics. “We follow the GSS Code of Practice,” Elizabeth explained. “You need to notify ministers, pre-announce releases—it’s a formal process. That’s why the data doesn’t appear until February or March the following year.” The future, however, looks very different. The vision is to remove the R199B process altogether. Instead, pulling authoritative road length data annually from Highways or the National Geographic Database (NGD), creating a single, consistent source.
“We’re trying to reduce your burden,” Richard said. “And preserve the fact that local authorities—you—know your streets best. If your data goes in accurately, that’s what gets used.”
Progress so far has been significant. The national road classification review completed last year aligned many discrepancies between the NSG and OS Highways—such as mislabelled A-roads or mismatched numbers. In parallel, GeoPlace and DfT have pushed for broader data quality improvements, including street lifecycle tagging (from construction to open) and the inclusion of ‘streets through buildings’, helping to identify links and align better with OS MasterMap Highways.
Another big shift is reworking the treatment of C and unclassified roads (C&Us)—particularly around whether they’re publicly maintainable. Historically, this was only verifiable in R199B years. But with new tooling, that’s changing.
DfT, GeoPlace and OS are now piloting use of detailed road geometry—points, lines, and polygons—to directly identify maintainable segments, without requiring manual R199B submissions. Elizabeth illustrated this with a real example: a section flagged with points showing it wasn’t publicly maintained, surrounded by green polygon data confirming where public responsibility begins and ends. This visual clarity enables more precise funding decisions. Phase one is already complete. Phase two—internal dual running of old and new methods—starts in July. “We’ll reach out if any big anomalies appear,” she said.
The ambition is to make this the new default by January next year, with one caveat: if a local authority’s data still doesn’t align, they may still be asked to submit an R199B next year. “Hopefully not many,” Elizabeth said. “So the big message is: get your LSG accurate, now. The better your data, the less chance we must instigate another R199b.”
Looking ahead, the pair outlined further initiatives to support local authorities:
- Data dashboards now help GeoPlace and Ordnance Survey monitor discrepancies and feed issues into health checks.
- A joint OS–GeoPlace streets market review identified key barriers to data alignment—particularly in specification mismatches and classification.
- Work is ongoing to integrate classification checks into automated health checks, allowing OS to more easily validate local submissions.
- A specification review is exploring ways to better attach maintainability flags to ESUs (Elementary Street Units), improving identification of public vs. private roads.
- And for those sick of filling out reclassification spreadsheets—good news. A new web-based tool is under active development to replace the existing .gov form. Richard acknowledged the pain: “Everyone wants to see the back of that spreadsheet just as much as the back of the R199B.”
They closed with three clear messages:
1. DfT is committed to ending the R199B process and shifting to NSG and Highways data as the official source of road length statistics.
2. Custodians are vital. The quality of local data directly affects funding and national statistics.
3. Act now. Keep your Local Street Gazetteer up to date—especially by the March snapshot deadline each year.
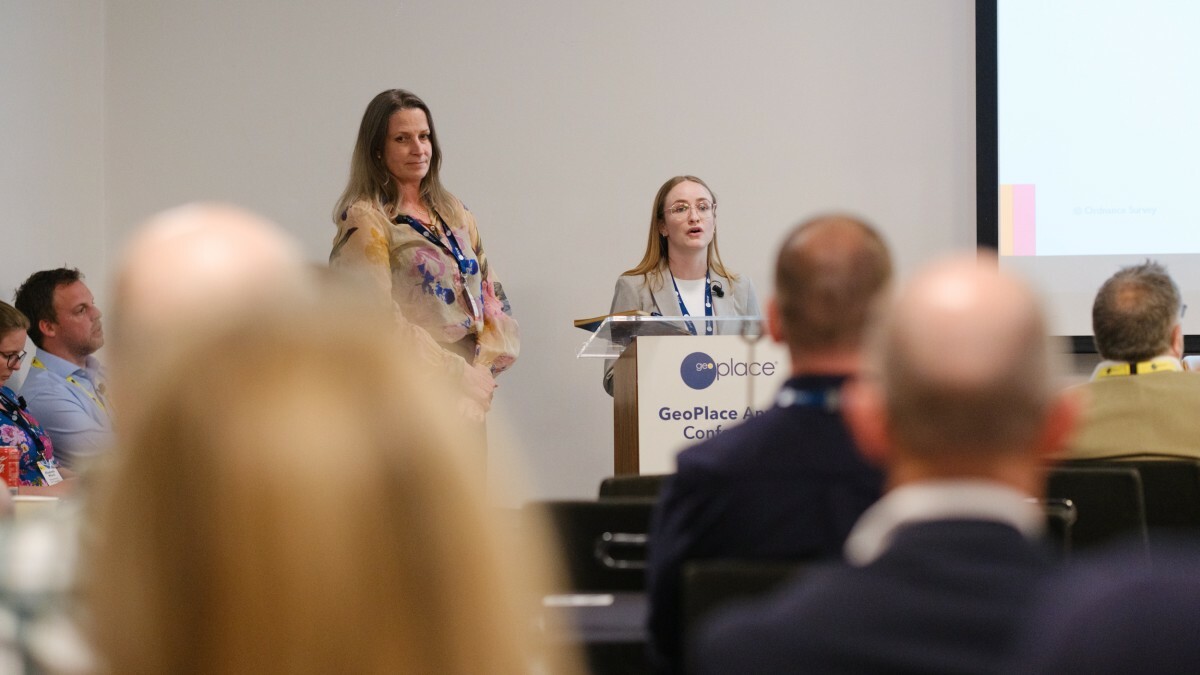
Katie Packard - Product Manager, Ordnance Survey, and Nicky Southam - Strategic Product Manager, Ordnance Survey
Katie Packard and Nicky Southam delivered a compelling session on how Ordnance Survey is enabling smarter, more connected transport planning through the Multimodal Routing Network (MRN) — a fully integrated dataset designed to support real-world routing across multiple modes of transport.
“We work in the networks portfolio,” Katie began, “and today we wanted to show how the MRN connects people and places — and how it’s already supporting use cases in the real world.”
At its heart, the MRN is about connectivity. The dataset incorporates roads, railways, ferries, and walking paths into a single, routable network. Crucially, it includes modal change points — places where travellers can switch modes of transport, such as at stations, bus depots, or car parks. Nicky explained the rationale: “Transport networks are evolving. It’s no longer just about road routing. Whether it’s cycling, walking, wheeling or integrating with public transport — users need a holistic view of movement. Our role is to help make those connections visible.”
Katie outlined how the product was shaped through discovery work with public sector users. “Customers told us they needed to understand the interaction points between networks. And they wanted less complexity in using the data for routing. That’s why we built MRN — to be straightforward to use, with everything in one dataset.” Unlike OS’s previous data formats, the MRN is structured using an OpenStreetMap (OSM) schema. This makes it easier to ingest into both open source and proprietary routing engines. All routes are expressed as generic ‘transport links’, with tags denoting access types — whether by car, on foot, or by train.
MRN does not contain public transport timetables or routes itself — but is designed to work seamlessly alongside open datasets like the Bus Open Data Service (BODS) and national rail feeds.
Katie demonstrated how MRN, used with tools like OpenTripPlanner, can generate realistic A-to-B multimodal routes by combining walking paths with live bus schedules. "It's not just about transport modelling," she said. "It's about planning real lives, real services, in real places." Three recent case studies showcased the value of MRN in action:
1. Sport England – strategic planning for facility access
Sport England used MRN to generate walk, cycle, and drive catchment areas around sports facilities, integrating it into a national website tool. The speed and accessibility data meant they could reduce pre-processing time and model real-world conditions more accurately. This informed investment decisions and policy development.
2. Northumberland County Council – mobile library routing
Faced with a reduced fleet for mobile libraries (down from three to two vehicles), Northumberland Council used MRN’s average speed data to optimise routes by time rather than distance — vital for navigating country lanes where legal limits don’t reflect reality. This improved scheduling, reduced staff overtime, and ensured equitable service delivery.
3. Torfaen County Borough Council – school catchments at scale
Torfaen used MRN to calculate pedestrian-based school catchment areas for over 20 schools. Thanks to the OSM-style schema, they ran previously time-intensive analyses (once taking up to two weeks per school) in a matter of seconds. They are now looking to extend use of MRN into forward planning for new housing and employment sites.
Nicky then shared the roadmap, showing how Ordnance Survey is evolving the National Geographic Database (NGD) alongside MRN. Southam emphasised that this evolution is being shaped directly by customer feedback and use case demand. “We want to hear from you,” she said. “Your insight helps us prioritise what to build, and how fast to deliver it.”
As Katie concluded, “It’s exciting to see where this is going — from school catchments to library services to national investment strategies. MRN is already proving itself as a foundational tool for building better-connected places.”